
TRS Software – Drive your industrial performance in real time
Automatic collection, continuous calculation, visual management: identify your losses and earn 5 to 15 TRS points in the first few weeks.
✓ +5 to +15 points of TRS in the first few weeks
✓ Installation in 1 day, without stopping production
Leancure allowed us to monitor our TRLs visually and work on the real problems that strongly impact our productivity.»
— Production Director, Agro-Food Industry, Kusmi Tea
You know your TRS from last week. Not the one from this hour.
Without real-time data, losses are identified Too late, The causes remain floues, and the improvement plans Lack of reliable base. One minute of unplanned downtime is much more than a minute of production lost.
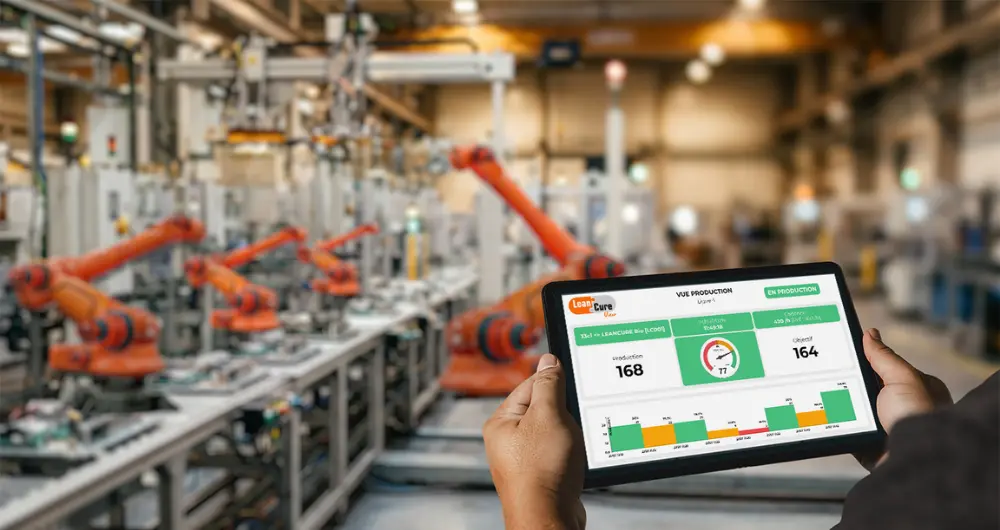
TRS: definition, calculation and impact on industrial performance
Availability
Actual production time / Total planned time
Performance
Net time / operating time
Quality
Compliant parts / Total parts produced
TRS = Availability × Performance × Quality
An 85% TRS is a good starting point. The best organizations have 90 or even 95%.
How does the TRS Performance module work?
Automatic collection of data
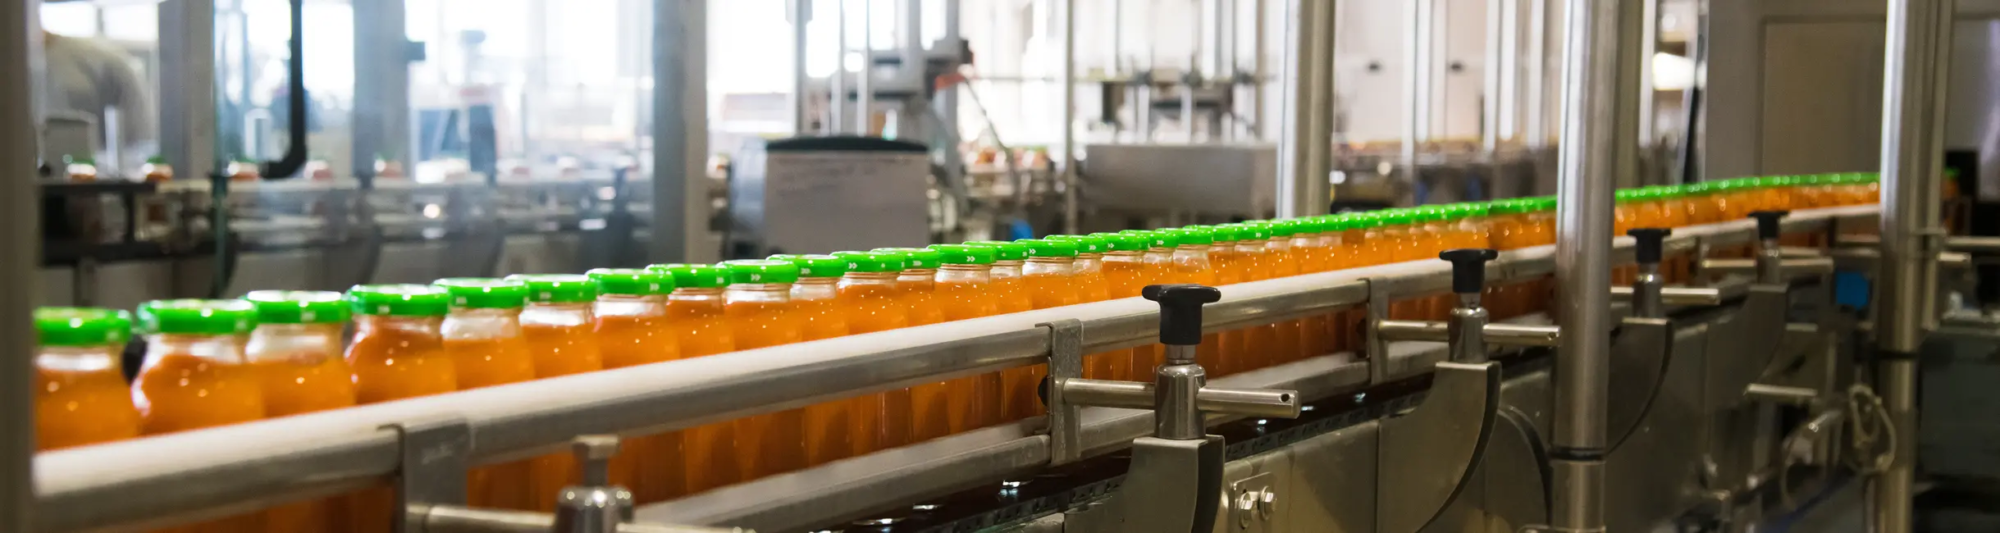
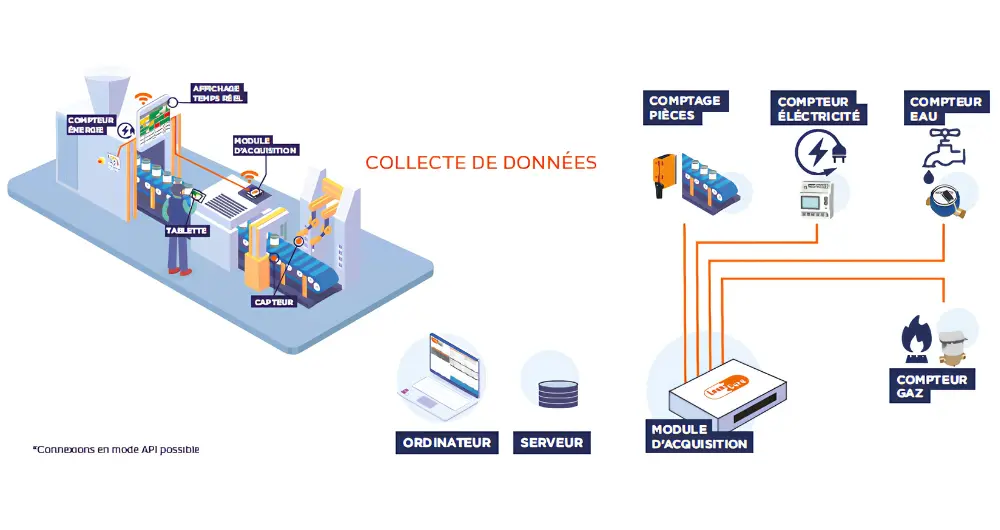
Unplanned stops, planned stops, micro-stops, real cadence, good and bad quantities: everything is recorded without manual input. The operator qualifies the causes in a few seconds on a tablet.
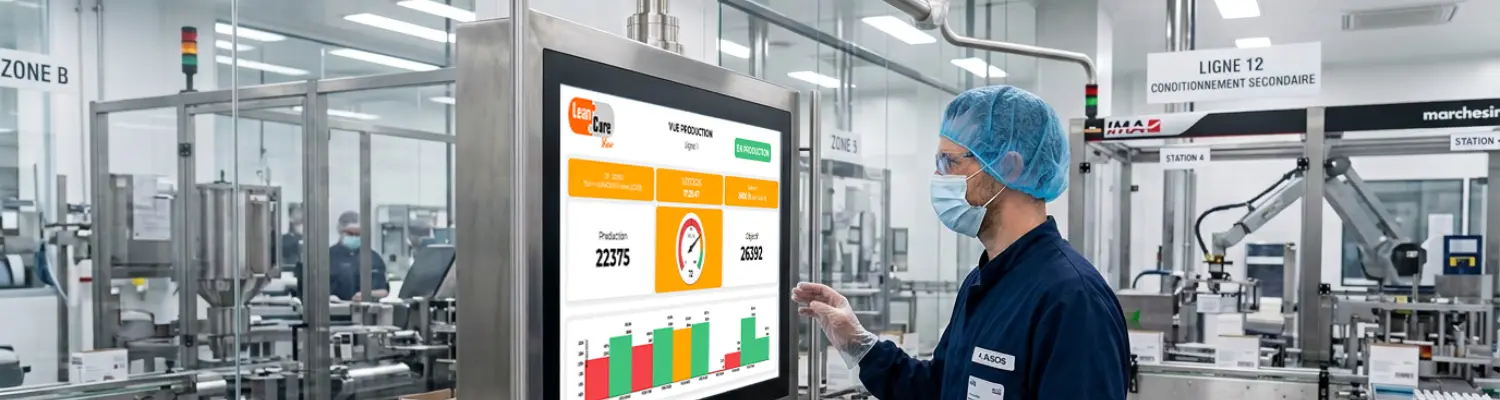
TRS calculated and displayed in real time
Your teams see their performance minute by minute. Your managers have access to a consolidated view, from any position, without any limit on the number of users.
Visual management of the workshop
An instantly readable interface, immediate alerts, and a natural involvement of the teams. Performance monitoring becomes a natural reflex on the field, not an administrative constraint. This increased responsiveness alone generates the top five points of TRS.
Customizable analysis and reporting
Fifteen models of analysis available in a single click. Compare performance by line, by team, by period. Prioritize your continuous improvement plans with reliable data.
Why choose Leancure for the monitoring of your TRS
+5 to 15 pts
from TRS from the very first weeks
1 day
continuous installation of production
3 to 6 months
to achieve a return on investment
✓ Immediate reactivity: anomalies detected in real time
✓ Zero manual recovery: reliable and actionable data
✓ Operators involved: intuitive and accessible interface
A simple connection to your existing equipment
Acquisition module
Connected to your existing sensors. Detection of operating states, stops, and rates.
Automate
Direct connection if your lines are already equipped. Real-time data retrieval.
OPC UA
Industrial standard open. Native connection, no specific development required.
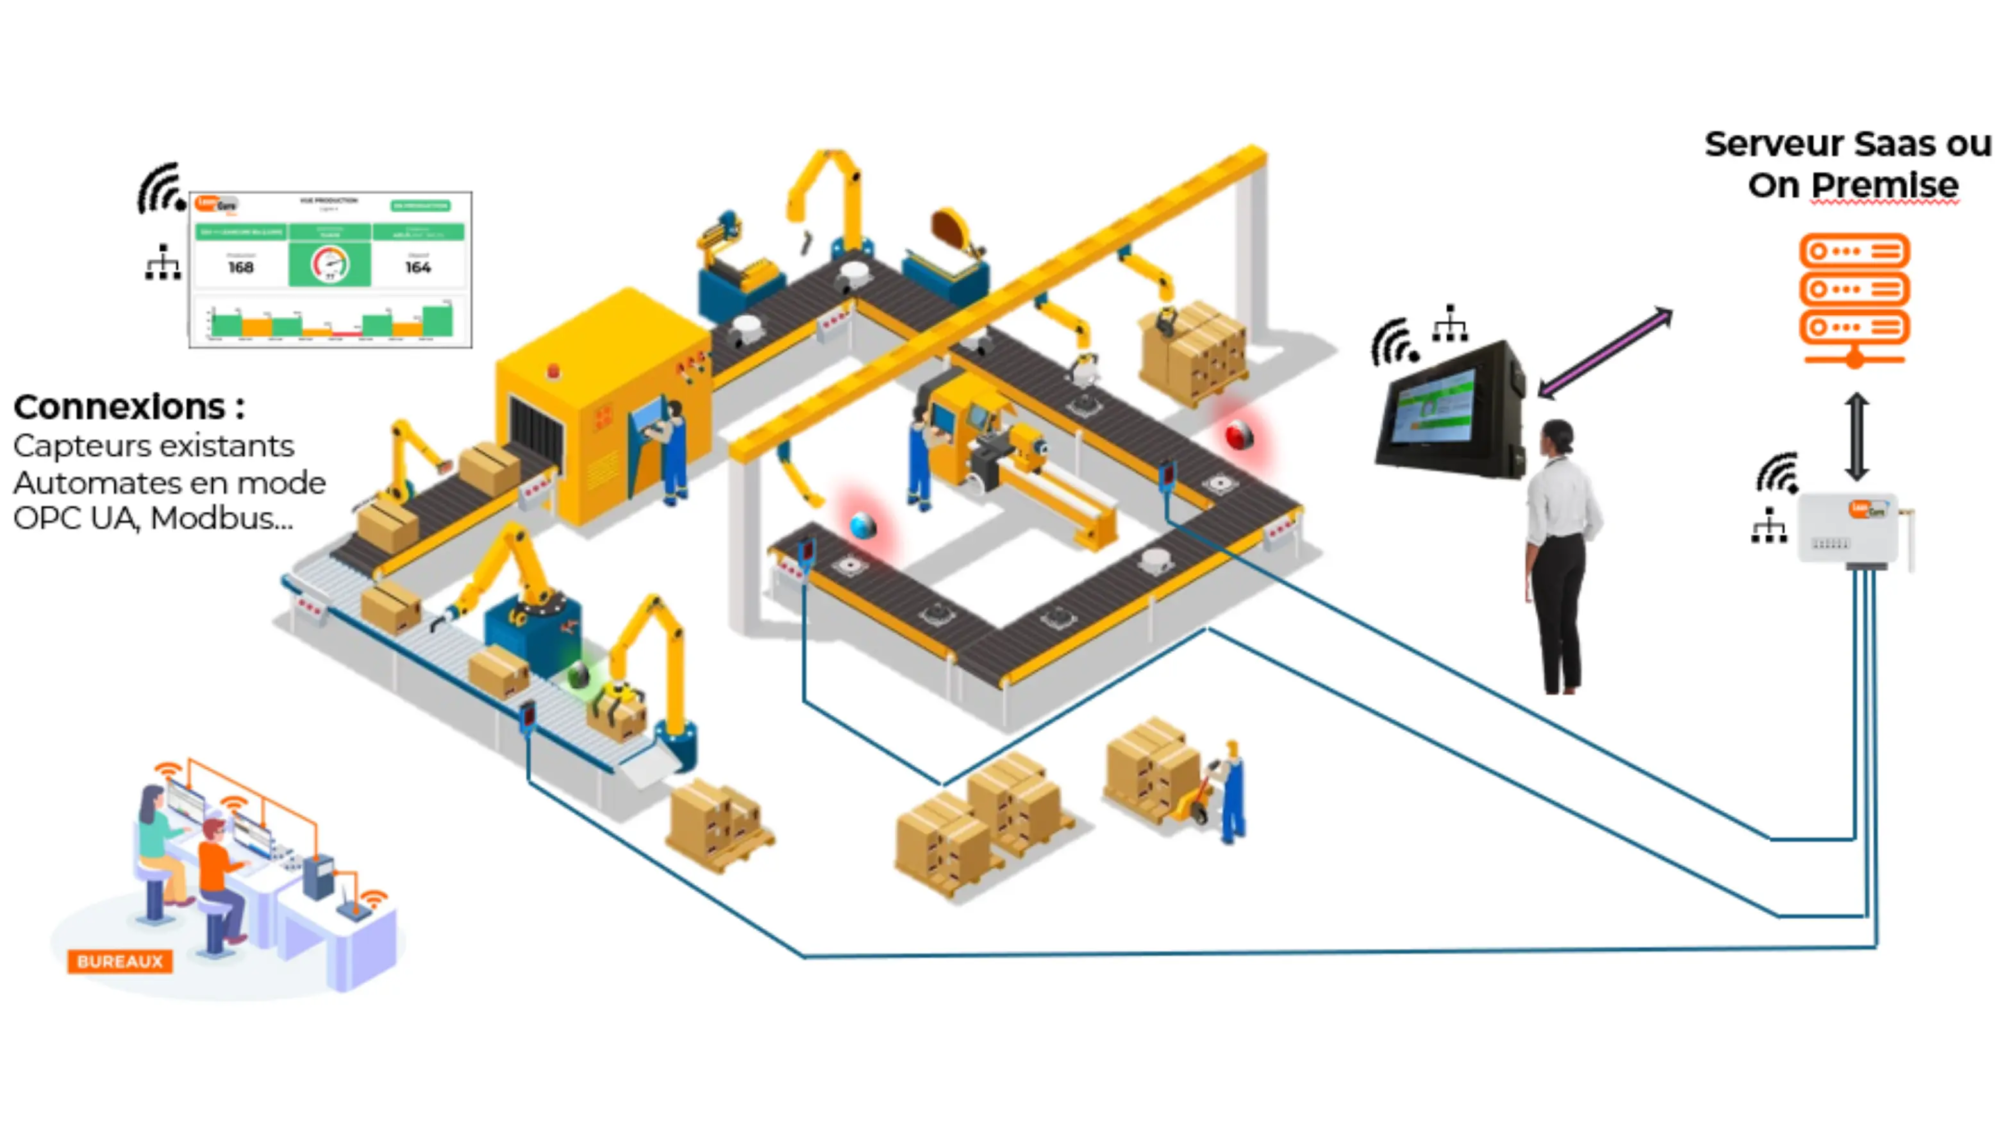
A simple connection to your existing equipment
Acquisition module
Connected to your existing sensors. Detection of operating states, stops, and rates.
Automate
Direct connection if your lines are already equipped. Real-time data retrieval.
OPC UA
Industrial standard open. Native connection, no specific development required.
How much is 1 TRS point earned on your lines worth?
Enter your production data and get an estimate in less than 2 minutes. No registration required.
WITHOUT COMMITMENT
Test the TRS module on a line. Measure the results. Then decide.
Installation in 1 day, training included, data in real time the next day.
✓ 95 to 98% of the pilot lines → full deployment
✓No operational risk – production not interrupted
✓ ROI visible as early as the first weeks
Go further with the other Leancure View MES modules
Performance Energy Industry
Track energy consumption and TRS. Identify equipment that consumes more power during downtime.
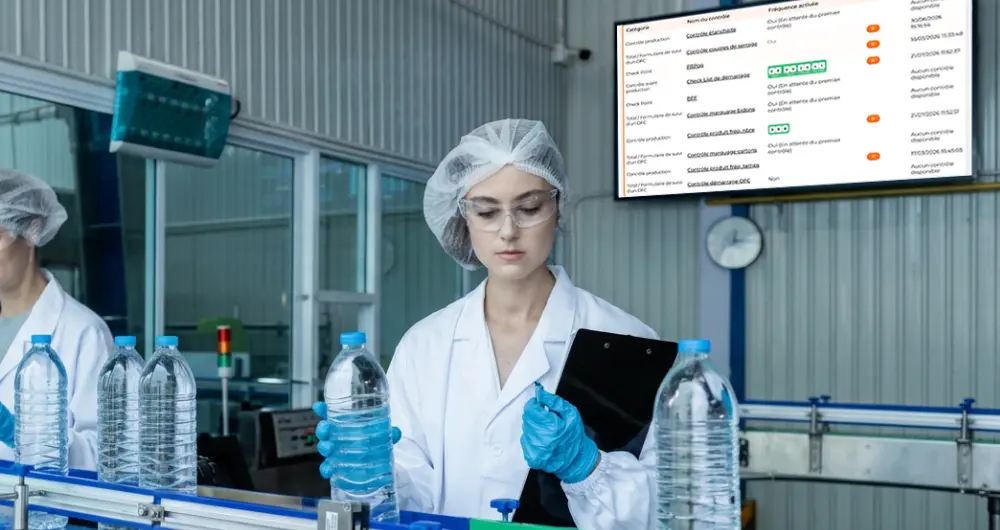
Quality, control and traceability software
Digitize your checklists, trace your batches, reduce your rejects — and improve the Quality Rate of your TRS.
Go further with the other Leancure View MES modules
Performance Energy Industry
Track energy consumption and TRS. Identify equipment that consumes more power during downtime.
Quality, control and traceability software
Digitize your checklists, trace your batches, reduce your rejects — and improve the Quality Rate of your TRS.
Frequently asked questions about the TRS software
Your production losses have a cost.
Start measuring them.
First results in a few weeks. ROI in 3 to 6 months.
 Français
 English
 Türkçe
 Polski
 Español
 العربية
 Italiano